原文地址 翻译:DeveloperLx
Update 9/22/16: This tutorial has been updated for Xcode 8 and Swift 3.

You’ve seen a lot of apps that depict beautiful graphics and stylish custom views. The best of them make a lasting impression, and you always remember them because they are just so pretty.
Core Graphics is Apple’s 2D drawing engine, and is one of the coolest frameworks in macOS and iOS. It has capacity to draw anything you can imagine, from simple shapes and text to more complex visual effects that include shadows and gradients.
In this Core Graphics on macOS tutorial, you’ll build up an app named DiskInfo to create a custom view that displays the available space and file distribution of a hard drive. It’s a solid example of how you can use Core Graphics to make a dull, text-based interface beautiful:

Along the way you’ll discover how to:
- Create and configure a custom view, the base layer for any graphical element
- Implement live rendering so that you don’t have to build and run every time you change your graphics
- Paint with code by working with paths, fills, clipping areas and strings
- Use Cocoa Drawing , a tool available to AppKit apps, which defines higher level classes and functions
In the first part of this Core Graphics on macOS tutorial, you’ll implement the bar chart using Core Graphics, before moving on to learn how to draw the pie chart using Cocoa Drawing.
So put on your painter’s hat and get ready to learn how to color your world.
First, download the starter project for DiskInfo here . Build and run it now.

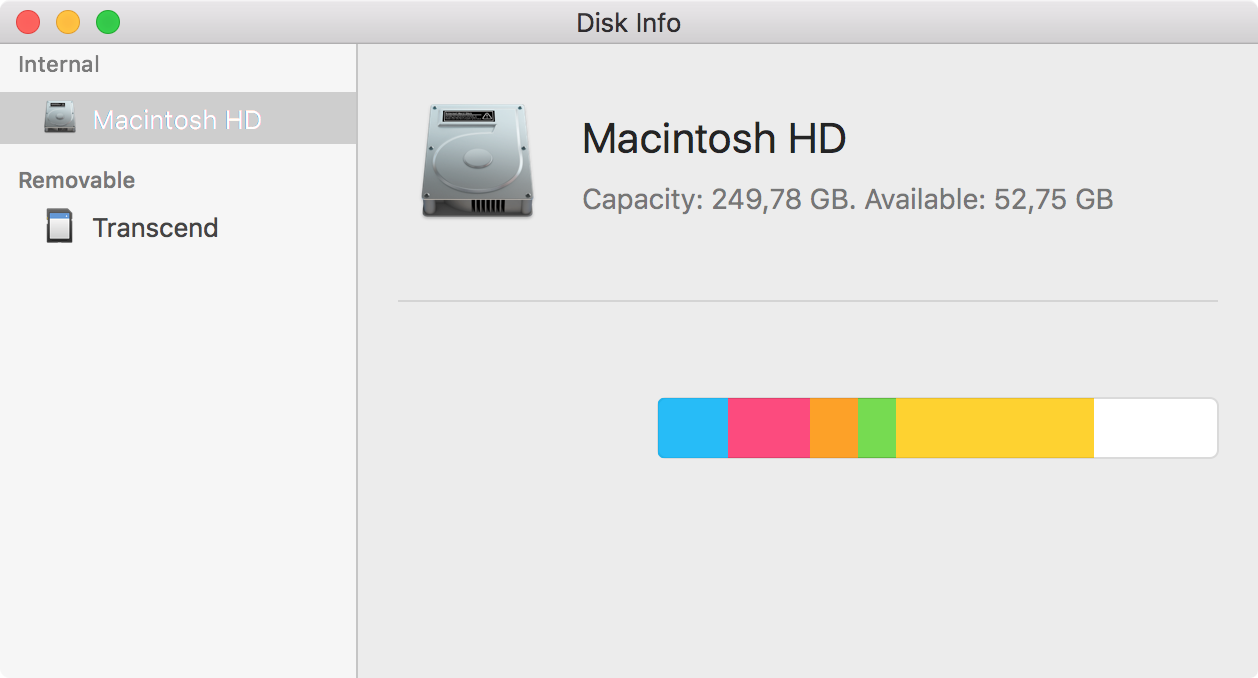
The app lists all your hard drives, and when you click on one it shows detailed information.
Before going any further, have a look at the structure of the project to become familiar with the lay of the land:
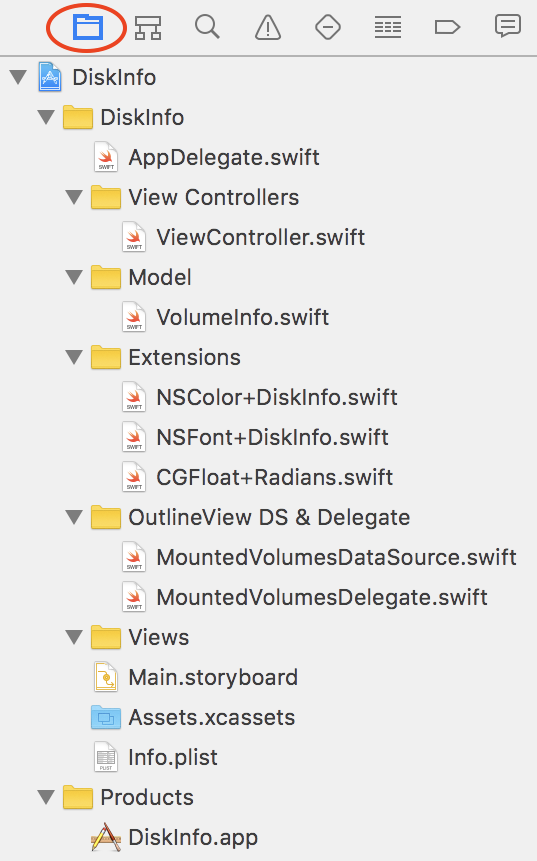
How about a guided tour?
- ViewController.swift : The main view controller of the application
-
VolumeInfo.swift
: Contains the implementation of the
VolumeInfoclass, which reads the information from the hard drive, and theFilesDistributionstruct that handles the split between file types - NSColor+DiskInfo.swift and NSFont+DiskInfo.swift : Extensions that define constants with the default colors and fonts
- CGFloat+Radians.swift : Extension that converts between degrees and radians via some helper functions
- MountedVolumesDataSource.swift and MountedVolumesDelegate.swift : Implement the required methods to show disk information in the outline view
Note: The app shows the correct disk usage information, but for the sake this tutorial, it creates a random file distribution.
Calculating the real file distribution each time you run the app will quickly become a time drain and spoil all your fun, and nobody wants that.
Your first to-do is to create a custom view named
GraphView
. It’s where you’ll draw the pie and bar charts, so it’s pretty important.
You need to accomplish two objectives to create a custom view:
-
Create an
NSViewsubclass. -
Override
draw(_:)and add some drawing code.
On a high level, it’s as easy as that. Follow the next steps to learn how to get there.
Select the Views group in the Project Navigator. Choose File \ New \ File… and select the macOS \ Source \ Cocoa Class file template.
Click
Next
, and in the ensuing screen, name the new class
GraphView
. Make it a subclass of
NSView
, and make sure that the language is
Swift
.
Click Next and Create to save your new file.
Open Main.storyboard , and go the the View Controller Scene. Drag a Custom View from the Objects Inspector into the custom view as shown:

Select that new custom view, and in the
Identity Inspector
, set the class name to
GraphView
.

You need some constraints, so with the graph view selected, click on the Pin button in the Auto Layout toolbar. On the popup, set 0 for the Top , Bottom , Leading and Trailing constraints, and click the Add 4 Constraints button.

Click the triangular Resolve Auto Layout Issues button in the Auto Layout toolbar, and under the Selected Views section, click on Update Frames — should it show as disabled, click anywhere to deselect the new GraphView, and then re-select it.

Open
GraphView.swift
. You’ll see that
Xcode
created a default implementation of
draw(_:)
. Replace the existing comment with the following, ensuring that you leave
the call to the superclass method:
NSColor.white.setFill() NSRectFill(bounds)
|
First you set the fill color to white, and then you call the
NSRectFill
method to fill the view background with that color.
Build and run.

Your custom view’s background has changed from standard gray to white.

Yes, it’s that easy to create a custom drawn view.
Xcode 6 introduced an amazing feature: live rendering. It allows you to see how your custom view looks in Interface Builder — without the need to build and run.
To enable it, you just need to add the
@IBDesignable
annotation to your class, and optionally, implement
prepareForInterfaceBuilder()
to provide some sample data.
Open GraphView.swift and add this just before the class declaration:
@IBDesignable
|
Now, you need to provide sample data. Add this inside the
GraphView
class:
                            var fileDistribution: FilesDistribution? { didSet { needsDisplay = true
                            } }   override func prepareForInterfaceBuilder() { let used = Int64(100000000000)
                            let available = used / 3 let filesBytes = used / 5 let distribution: [FileType]
                            = [ .apps(bytes: filesBytes / 2, percent: 0.1), .photos(bytes: filesBytes,
                            percent: 0.2), .movies(bytes: filesBytes * 2, percent: 0.15), .audio(bytes:
                            filesBytes, percent: 0.18), .other(bytes: filesBytes, percent: 0.2) ] fileDistribution
                            = FilesDistribution(capacity: used + available, available: available, distribution:
                            distribution) }
|
This defines the property
fileDistribution
that will store hard drive information. When the property changes, it
sets the
needsDisplay
property of the view to
true
to force the view to redraw its content.
Then it implements
prepareForInterfaceBuilder()
to create a sample file distribution that Xcode will use to render the
view.
Note
: You can also change the visual attributes of your custom views in real
time inside Interface Builder. You just need to add the
@IBInspectable
annotation to a property.
Next up: make all the visual properties of the graph view inspectable.
Add the following code inside the
GraphView
implementation:
                            // 1 fileprivate struct Constants { static let barHeight: CGFloat = 30.0
                            static let barMinHeight: CGFloat = 20.0 static let barMaxHeight: CGFloat
                            = 40.0 static let marginSize: CGFloat = 20.0 static let pieChartWidthPercentage:
                            CGFloat = 1.0 / 3.0 static let pieChartBorderWidth: CGFloat = 1.0 static
                            let pieChartMinRadius: CGFloat = 30.0 static let pieChartGradientAngle:
                            CGFloat = 90.0 static let barChartCornerRadius: CGFloat = 4.0 static let
                            barChartLegendSquareSize: CGFloat = 8.0 static let legendTextMargin: CGFloat
                            = 5.0 }   // 2 @IBInspectable var barHeight: CGFloat = Constants.barHeight
                            { didSet { barHeight = max(min(barHeight, Constants.barMaxHeight), Constants.barMinHeight)
                            } } @IBInspectable var pieChartUsedLineColor: NSColor = NSColor.pieChartUsedStrokeColor
                            @IBInspectable var pieChartAvailableLineColor: NSColor = NSColor.pieChartAvailableStrokeColor
                            @IBInspectable var pieChartAvailableFillColor: NSColor = NSColor.pieChartAvailableFillColor
                            @IBInspectable var pieChartGradientStartColor: NSColor = NSColor.pieChartGradientStartColor
                            @IBInspectable var pieChartGradientEndColor: NSColor = NSColor.pieChartGradientEndColor
                            @IBInspectable var barChartAvailableLineColor: NSColor = NSColor.availableStrokeColor
                            @IBInspectable var barChartAvailableFillColor: NSColor = NSColor.availableFillColor
                            @IBInspectable var barChartAppsLineColor: NSColor = NSColor.appsStrokeColor
                            @IBInspectable var barChartAppsFillColor: NSColor = NSColor.appsFillColor
                            @IBInspectable var barChartMoviesLineColor: NSColor = NSColor.moviesStrokeColor
                            @IBInspectable var barChartMoviesFillColor: NSColor = NSColor.moviesFillColor
                            @IBInspectable var barChartPhotosLineColor: NSColor = NSColor.photosStrokeColor
                            @IBInspectable var barChartPhotosFillColor: NSColor = NSColor.photosFillColor
                            @IBInspectable var barChartAudioLineColor: NSColor = NSColor.audioStrokeColor
                            @IBInspectable var barChartAudioFillColor: NSColor = NSColor.audioFillColor
                            @IBInspectable var barChartOthersLineColor: NSColor = NSColor.othersStrokeColor
                            @IBInspectable var barChartOthersFillColor: NSColor = NSColor.othersFillColor
                              // 3 func colorsForFileType(fileType: FileType) -> (strokeColor:
                            NSColor, fillColor: NSColor) { switch fileType { case .audio(_, _): return
                            (strokeColor: barChartAudioLineColor, fillColor: barChartAudioFillColor)
                            case .movies(_, _): return (strokeColor: barChartMoviesLineColor, fillColor:
                            barChartMoviesFillColor) case .photos(_, _): return (strokeColor: barChartPhotosLineColor,
                            fillColor: barChartPhotosFillColor) case .apps(_, _): return (strokeColor:
                            barChartAppsLineColor, fillColor: barChartAppsFillColor) case .other(_,
                            _): return (strokeColor: barChartOthersLineColor, fillColor: barChartOthersFillColor)
                            } }
|
This is what the code above does:
- Declares a struct with constants — magic numbers in code are a no-no — you’ll use them throughout the tutorial.
- Declares all the configurable properties of the view as @IBInspectable and sets them using the values in NSColor+DiskInfo.swift . Pro tip: To make a property inspectable, you must declare its type, even when it’s obvious from the contents.
- Defines a helper method that returns the stroke and fill colors to use for a file type. It’ll come in handy when you draw the file distribution.
Open Main.storyboard and have a look at the graph view. It’s now white instead of the default view color, meaning that live rendering is working. Have patience if it’s not there right away; it may take a second or two to render.
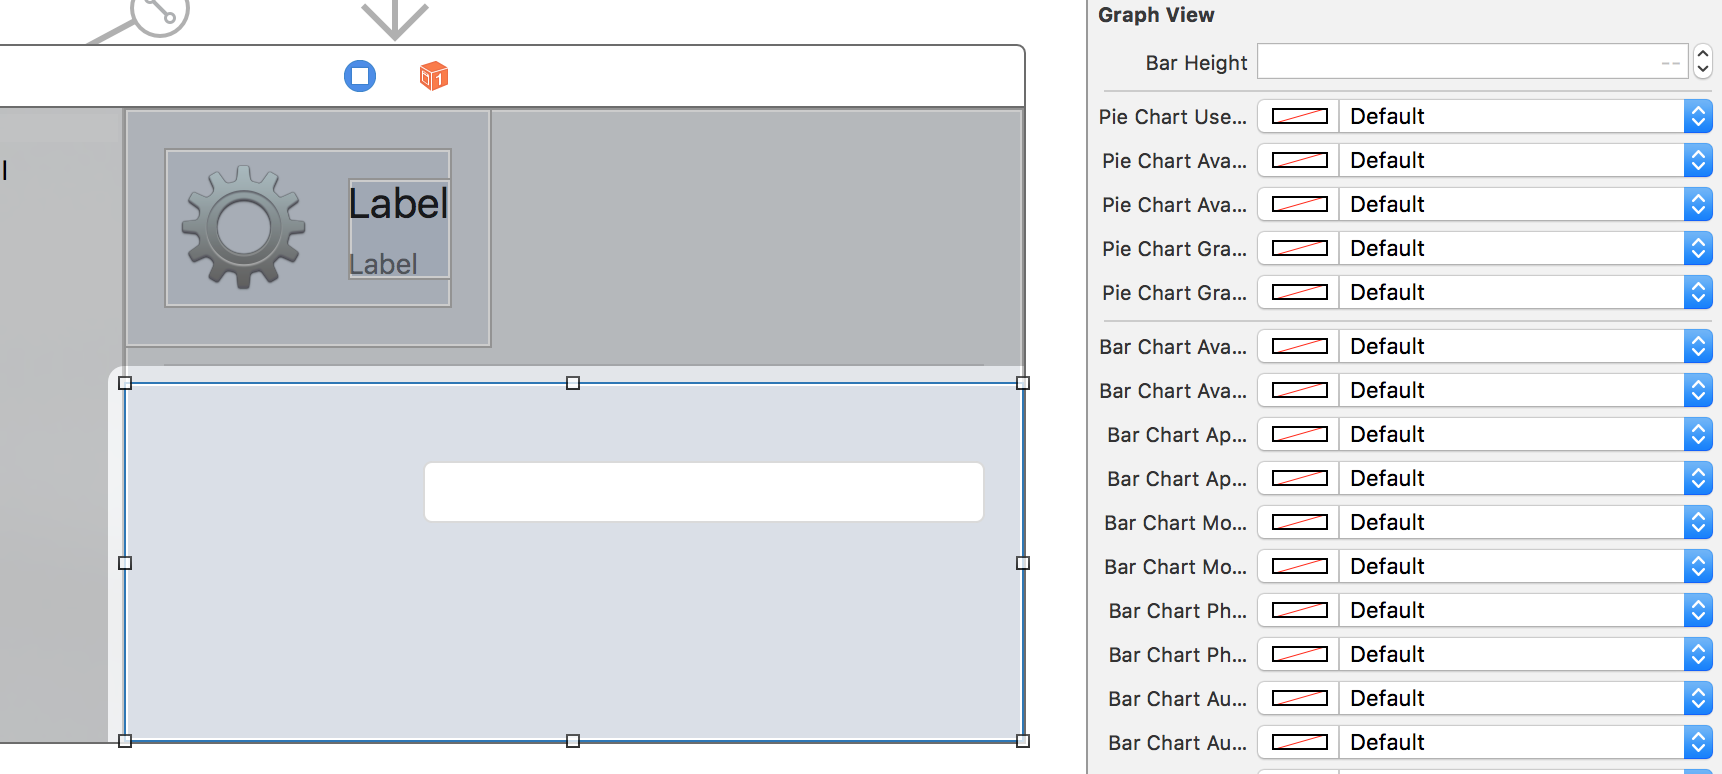
Select the graph view and open the Attributes Inspector . You’ll see all of the inspectable properties you’ve added.

From now on, you can choose to build and run the app to see the results, or just check it in Interface Builder.
Time to do some drawing.
When you use Core Graphics, you don’t draw directly into the view. You use a Graphics Context , and that’s where the system renders the drawing and displays it in the view.

Core Graphics uses a “painter’s model”, so when you draw into a context, think of it as if you were swooshing paint across a canvas. You lay down a path and fill it, and then lay down another path on top and fill it. You can’t change the pixels that have been laid down, but you can paint over them.
This concept is very important, because ordering affects the final result.

To draw a shape in Core Graphics, you need to define a
path
, represented in Core Graphics by the type
CGPathRef
and its mutable representation
CGMutablePathRef
. A path is simply a vectorial representation of a shape. It does not
draw itself.
When your path is ready, you add it to the context, which uses the path information and drawing attributes to render the desired graphic.
A rounded rectangle is the basic shape of the bar chart, so start there.
Open GraphView.swift and add the following extension at the end of the file, outside of the class definition:
                            // MARK: - Drawing extension   extension GraphView { func drawRoundedRect(rect:
                            CGRect, inContext context: CGContext?, radius: CGFloat, borderColor: CGColor,
                            fillColor: CGColor) { // 1 let path = CGMutablePath()   // 2 path.move(
                            to: CGPoint(x: rect.midX, y:rect.minY )) path.addArc( tangent1End: CGPoint(x:
                            rect.maxX, y: rect.minY ), tangent2End: CGPoint(x: rect.maxX, y: rect.maxY),
                            radius: radius) path.addArc( tangent1End: CGPoint(x: rect.maxX, y: rect.maxY
                            ), tangent2End: CGPoint(x: rect.minX, y: rect.maxY), radius: radius) path.addArc(
                            tangent1End: CGPoint(x: rect.minX, y: rect.maxY ), tangent2End: CGPoint(x:
                            rect.minX, y: rect.minY), radius: radius) path.addArc( tangent1End: CGPoint(x:
                            rect.minX, y: rect.minY ), tangent2End: CGPoint(x: rect.maxX, y: rect.minY),
                            radius: radius) path.closeSubpath()   // 3 context?.setLineWidth(1.0)
                            context?.setFillColor(fillColor) context?.setStrokeColor(borderColor)
                            // 4 context?.addPath(path) context?.drawPath(using: .fillStroke) } }
|
TL/DR: That is how you draw a rectangle. Here’s a more comprehensive explanation:
- Create a mutable path.
- Form the rounded rectangle path, following these steps:
- Move to the center point at the bottom of the rectangle.
-
Add the lower line segment at the bottom-right corner using
addArc(tangent1End:tangent2End:radius). This method draws the horizontal line and the rounded corner. - Add the right line segment and the top-right corner.
- Add the top line segment and the top-left corner.
- Add the right line segment and the bottom-left corner.
- Close the path, which adds a line from the last point to the starter point.
- Set the drawing attributes: line width, fill color and border color.
-
Add the path to the context and draw it using the
.fillStrokeparameter, which tells Core Graphics to fill the rectangle and draw the border.
You’ll never look at a rectangle the same way! Here’s the humble result of all that code:

Note : For more information about how path drawing works, check out Paths & Arcs in Apple’s Quartz 2D Programming Guide .
Drawing with Core Graphics is all about calculating the positions of the visual elements in your view. It’s important to plan where to locate the different elements and think through they should behave when the size of the view changes.
Here’s the layout for your custom view:

Open GraphView.swift and add this extension:
                            // MARK: - Calculations extension   extension GraphView { // 1 func
                            pieChartRectangle() -> CGRect { let width = bounds.size.width * Constants.pieChartWidthPercentage
                            - 2 * Constants.marginSize let height = bounds.size.height - 2 * Constants.marginSize
                            let diameter = max(min(width, height), Constants.pieChartMinRadius) let
                            rect = CGRect(x: Constants.marginSize, y: bounds.midY - diameter / 2.0,
                            width: diameter, height: diameter) return rect }   // 2 func barChartRectangle()
                            -> CGRect { let pieChartRect = pieChartRectangle() let width = bounds.size.width
                            - pieChartRect.maxX - 2 * Constants.marginSize let rect = CGRect(x: pieChartRect.maxX
                            + Constants.marginSize, y: pieChartRect.midY + Constants.marginSize, width:
                            width, height: barHeight) return rect }   // 3 func barChartLegendRectangle()
                            -> CGRect { let barchartRect = barChartRectangle() let rect = barchartRect.offsetBy(dx:
                            0.0, dy: -(barchartRect.size.height + Constants.marginSize)) return rect
                            } }
|
The above code does all of these required calculations:
- Start by calculating the position of the pie chart — it’s in the center vertically and occupies one third of the view’s width.
- Here you calculate the position of the bar chart. It takes two thirds of the width and it’s located above the vertical center of the view.
- Then you calculate the position of the graphics legend, based on the minimum Y position of the pie chart and the margins.
Time to draw it in your view. Add this method inside the
GraphView
drawing extension:
                            func drawBarGraphInContext(context: CGContext?) { let barChartRect = barChartRectangle()
                            drawRoundedRect(rect: barChartRect, inContext: context, radius: Constants.barChartCornerRadius,
                            borderColor: barChartAvailableLineColor.cgColor, fillColor: barChartAvailableFillColor.cgColor)
                            }
|
You’ve added a helper method that will draw the bar chart. It draws a rounded rectangle as a background, using the fill and stroke colors for the available space. You can find those colors in the NSColor+DiskInfo extension.
Replace all the code inside
draw(_:)
with this:
                            super.draw(dirtyRect)   let context = NSGraphicsContext.current()?.cgContext
                            drawBarGraphInContext(context: context)
|
Here is where the actual drawing takes place. First, you get the view’s
current graphics context by invoking
NSGraphicsContext.current()
, and then you call the method to draw the bar chart.
Build and run. You’ll see the bar chart in it’s proper position.

Now, open
Main.storyboard
and select the
View Controller
scene.
You’ll see this:
Interface Builder now renders the view in real time. You can also change the colors and the view responds to those changes. How awesome is that?
You’re at the part where you make the distribution chart, a bar chart that looks like this:

Take a step back here and dabble in a bit of theory. As you know, each file type has its own color, and somehow, the app needs to calculate each bar’s width based on the corresponding file type’s percentage, and then draw each type with a unique color.
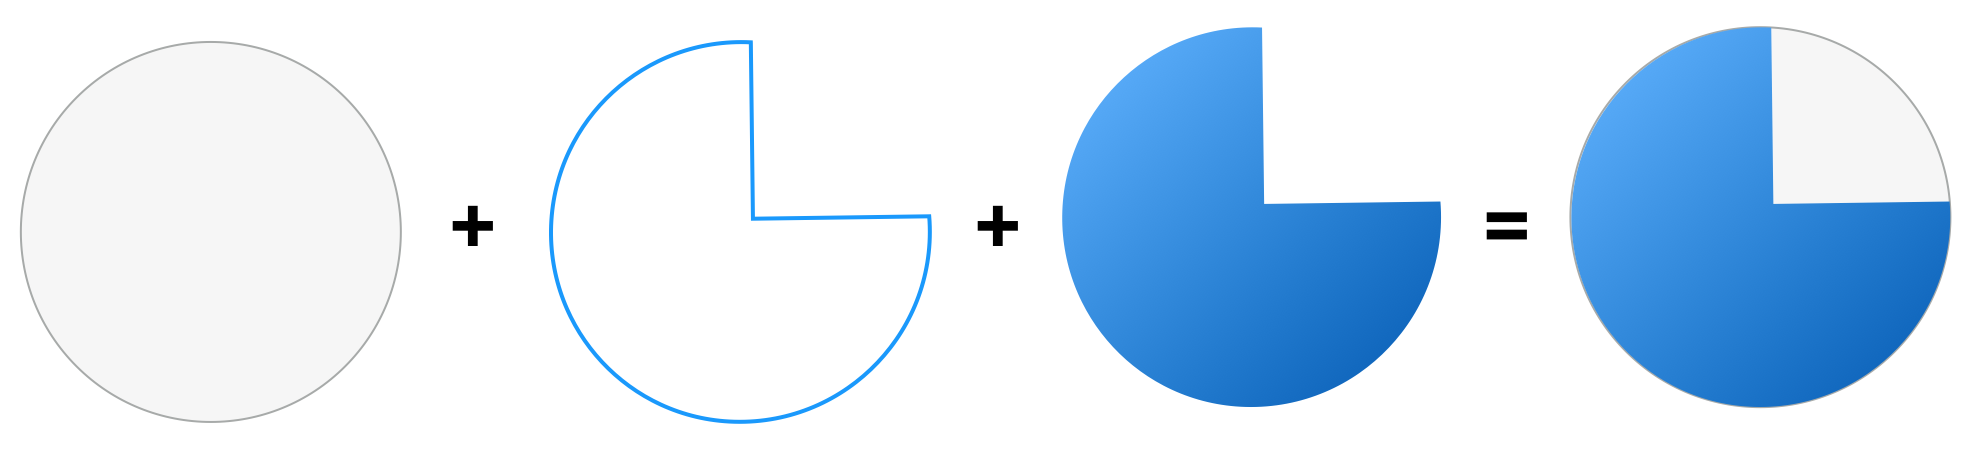
You could create a special shape, such as a filled rectangle with two lines at bottom and top of the rectangle, and then draw it. However, there is another technique that will let you reuse your code and get the same result: clipping areas .
You can think of a clipping area as a sheet of paper with a hole cut out of it, which you place over your drawing: you can only see the part of the drawing which shows through the hole. This hole is known as the clipping mask, and is specified as a path within Core Graphics.
In the case of the bar chart, you can create an identical fully-filled bar for each filetype, and then use a clipping-mask to only display the correct proportion, as shown in the following diagram:

With an understanding of how clipping areas work, you’re ready to make this bar chart happen.
Before drawing, you need to set the value for
fileDistribution
when a disk is selected. Open
Main.storyboard
and go to the
View Controller
scene to create an outlet.
Option-click on ViewController.swift in the Project Navigator to open it in the Assistant Editor , and Control-Drag from the graph view into the view controller class source code to create an outlet for it.

In the popup, name the outlet
graphView
and click
Connect
.

Open
ViewController.swift
and add this code at the end of
showVolumeInfo(_:)
:
graphView.fileDistribution = volume.fileDistribution
|
This code sets the
fileDistribution
value with the distribution of the selected disk.
Open
GraphView.swift
and add this code at the end of
drawBarGraphInContext(context:)
to draw the bar chart:
                            // 1 if let fileTypes = fileDistribution?.distribution, let capacity =
                            fileDistribution?.capacity, capacity > 0 { var clipRect = barChartRect
                            // 2 for (index, fileType) in fileTypes.enumerated() { // 3 let fileTypeInfo
                            = fileType.fileTypeInfo let clipWidth = floor(barChartRect.width * CGFloat(fileTypeInfo.percent))
                            clipRect.size.width = clipWidth   // 4 context?.saveGState() context?.clip(to:
                            clipRect)   let fileTypeColors = colorsForFileType(fileType: fileType)
                            drawRoundedRect(rect: barChartRect, inContext: context, radius: Constants.barChartCornerRadius,
                            borderColor: fileTypeColors.strokeColor.cgColor, fillColor: fileTypeColors.fillColor.cgColor)
                            context?.restoreGState()   // 5 clipRect.origin.x = clipRect.maxX
                            } }
|
This is what the code above does:
-
Makes sure there is a valid
fileDistribution. - Iterates through all the file types in the distribution.
- Calculates the clipping rect, based on the file type percentage and previous file types.
- Saves the state of the context, sets the clipping area and draws the rectangle using the colors configured for the file type. Then it restores the state of the context.
- Moves the x origin of the clipping rect before the next iteration.
You might wonder why you need to save and restore the state of the context. Remember the painter’s model? Everything you add to the context stays there.
If you add multiple clipping areas, you are in fact creating a clipping area that acts as the unifying force for all of them. To avoid that, you save the state before adding the clipping area, and when you’ve used it, you restore the context to that state, disposing of that clipping area.
At this point,
Xcode
shows a warning because
index
is never used. Don’t worry about it for now. You’ll fix it later on.
Build and run, or open Main.storyboard and check it out in Interface Builder.
It’s beginning to look functional. The bar chart is almost finished and you just need to add the legend.
Drawing a string in a custom view is super easy. You just need to create
a dictionary with the string attributes — for instance the font, size,
color, alignment — calculate the rectangle where it will be drawn, and
invoke
String
‘s method
draw(in:withAttributes:)
.
Open GraphView.swift and add the following property to the class:
fileprivate var bytesFormatter = ByteCountFormatter()
|
This creates an ByteCountFormatter . It does all the heavy work of transforming bytes into a human-friendly string.
Now, add this inside
drawBarGraphInContext(context:)
. Make sure you add it inside the
for (index,fileType) in fileTypes.enumerated()
loop:
                            // 1 let legendRectWidth = (barChartRect.size.width / CGFloat(fileTypes.count))
                            let legendOriginX = barChartRect.origin.x + floor(CGFloat(index) * legendRectWidth)
                            let legendOriginY = barChartRect.minY - 2 * Constants.marginSize let legendSquareRect
                            = CGRect(x: legendOriginX, y: legendOriginY, width: Constants.barChartLegendSquareSize,
                            height: Constants.barChartLegendSquareSize)   let legendSquarePath
                            = CGMutablePath() legendSquarePath.addRect( legendSquareRect ) context?.addPath(legendSquarePath)
                            context?.setFillColor(fileTypeColors.fillColor.cgColor) context?.setStrokeColor(fileTypeColors.strokeColor.cgColor)
                            context?.drawPath(using: .fillStroke)   // 2 let paragraphStyle =
                            NSMutableParagraphStyle() paragraphStyle.lineBreakMode = .byTruncatingTail
                            paragraphStyle.alignment = .left let nameTextAttributes = [ NSFontAttributeName:
                            NSFont.barChartLegendNameFont, NSParagraphStyleAttributeName: paragraphStyle]
                              // 3 let nameTextSize = fileType.name.size(withAttributes: nameTextAttributes)
                            let legendTextOriginX = legendSquareRect.maxX + Constants.legendTextMargin
                            let legendTextOriginY = legendOriginY - 2 * Constants.pieChartBorderWidth
                            let legendNameRect = CGRect(x: legendTextOriginX, y: legendTextOriginY,
                            width: legendRectWidth - legendSquareRect.size.width - 2 * Constants.legendTextMargin,
                            height: nameTextSize.height)   // 4 fileType.name.draw(in: legendNameRect,
                            withAttributes: nameTextAttributes)   // 5 let bytesText = bytesFormatter.string(fromByteCount:
                            fileTypeInfo.bytes) let bytesTextAttributes = [ NSFontAttributeName: NSFont.barChartLegendSizeTextFont,
                            NSParagraphStyleAttributeName: paragraphStyle, NSForegroundColorAttributeName:
                            NSColor.secondaryLabelColor] let bytesTextSize = bytesText.size(withAttributes:
                            bytesTextAttributes) let bytesTextRect = legendNameRect.offsetBy(dx: 0.0,
                            dy: -bytesTextSize.height) bytesText.draw(in: bytesTextRect, withAttributes:
                            bytesTextAttributes)
|
That was quite a bit of code, but it’s easy to follow:
- You’re already familiar with this code: calculate the position of the legend’s colored square, create a path for it and draw with the appropriate colors.
-
Create a dictionary of attributes that includes the font and a paragraph
style
NSMutableParagraphStyle. The paragraph defines how the string should be drawn inside the given rectangle. In this case, it’s left aligned with a truncated tail. - Calculate the position and size of the rectangle to draw the text in.
-
Draw the text invoking
draw(in:withAttributes:). -
Get the size string using the
bytesFormatterand create the attributes for the file size text. The main difference from the previous code is that this sets a different text color in the attributes dictionary viaNSFontAttributeName.
Build and run, or open Main.storyboard , to see the results).

The bar chart is complete! You can resize the window to see how it adapts to the new size. Watch how the text properly truncates when there isn’t enough space to draw it.
Looking great so far!
macOS apps come with the option to use AppKit framework to draw instead. It provides a higher level of abstraction. It uses classes instead of C functions and includes helper methods that make it easier to perform common tasks. The concepts are equivalent in both frameworks, and Cocoa Drawing is very easy to adopt if you’re familiar with Core Graphics.
As it goes in Core Graphics, you need to create and draw paths, using
NSBezierPath
, the equivalent of
CGPathRef
in Cocoa Drawing:
This is how the pie chart will look:

You’ll draw it in three steps:
- First, you create a circle path for the available space circle, and then you fill and stroke it with the configured colors.
- Then you create a path for the used space circle segment and stroke it.
- Finally, you draw a gradient that only fills the used space path.
Open GraphView.swift and add this method into the drawing extension:
                            func drawPieChart() { guard let fileDistribution = fileDistribution else
                            { return }   // 1 let rect = pieChartRectangle() let circle = NSBezierPath(ovalIn:
                            rect) pieChartAvailableFillColor.setFill() pieChartAvailableLineColor.setStroke()
                            circle.stroke() circle.fill()   // 2 let path = NSBezierPath() let
                            center = CGPoint(x: rect.midX, y: rect.midY) let usedPercent = Double(fileDistribution.capacity
                            - fileDistribution.available) / Double(fileDistribution.capacity) let endAngle
                            = CGFloat(360 * usedPercent) let radius = rect.size.width / 2.0 path.move(to:
                            center) path.line(to: CGPoint(x: rect.maxX, y: center.y)) path.appendArc(withCenter:
                            center, radius: radius, startAngle: 0, endAngle: endAngle) path.close()
                              // 3 pieChartUsedLineColor.setStroke() path.stroke() }
|
There are a few things to go through here:
-
Create a circle path using the constructor
init(ovalIn:), set the fill and stroke color, and then draw the path. -
Create a path for the used space circle segment. First, calculate the
ending angle based on the used space. Then create the path in four steps:
- Move to the center point of the circle.
- Add an horizontal line from the center to the right side of the circle.
- Add an arc from current point to the calculated angle.
- Close the path. This adds a line from the arc’s end point back to the center of the circle.
-
Set the stroke color and stroke the path by calling its
stroke()method.
You may have noticed a couple of differences compared to Core Graphics:
- There aren’t any reference to the graphics context in the code. That’s because these methods automatically get the current context, and in this case, it’s the view’s context.
- Angles are measured in degrees, not radians. CGFloat+Radians.swift extends CGFloat to do conversions if needed.
Now, add the following code inside
draw(_:)
to draw the pie chart:
drawPieChart()
|
Build and run.

Looking good so far!
Cocoa Drawing
uses
NSGradient
to draw a gradient.
You need to draw the gradient inside the used space segment of the circle, and you already know how to do it.
How will you do it? Exactly, clipping areas!
You’ve already created a path to draw it, and you can use it as a clipping path before you draw the gradient.
Add this code at the end of
drawPieChart()
:
                            if let gradient = NSGradient(starting: pieChartGradientStartColor, ending:
                            pieChartGradientEndColor) { gradient.draw(in: path, angle: Constants.pieChartGradientAngle)
                            }
|
In the first line, you try to create a gradient with two colors. If this
works, you call
draw(in:angle:)
to draw it. Internally, this method sets the clipping path for you and
draws the gradient inside it. How nice is that?
Build and run.

The custom view is looking better and better. There’s only one thing left to do: Draw the available and used space text strings inside the pie chart.
You already know how to do it. Are you up to the challenge? :]
This is what you need to do:
-
Use the
bytesFormatterto get the text string for the available space (fileDistribution.availableproperty ) and full space (fileDistribution.capacityproperty). - Calculate the position of the text so that you draw it in the middle point of the available and used segments.
- Draw the text in that position with these attributes:
-
Font:
NSFont.pieChartLegendFont -
Used space text color:
NSColor.pieChartUsedSpaceTextColor -
Available space text color:
NSColor.pieChartAvailableSpaceTextColor
| Solution Inside: Draw Pie Chart Legend | Select Show | |
|---|---|---|
|
Add this code inside the
This code does the following:
Now, build and run and see the final result of your handiwork.
|
||

Congratulations! You’ve built a beautiful app using Core Graphics and Cocoa Drawing!

You can download the completed project here .
This Core Graphics on macOS tutorial covered the basics of the different frameworks available to use for drawing custom views in macOS . You just covered:
- How to create and draw paths using Core Graphics and Cocoa Drawing
- How to use clipping areas
- How to draw text strings
- How to draw gradients
You should now feel confident in your abilities to use Core Graphics and Cocoa Drawing next time you need clean, responsive graphics.
If you’re looking to learn more, consider the following resources: